
Buffett indicator reaches all-time high
 ParadTrade
The US stock market has ignored all warnings and continues its rapid rally. However, now, according to the so-called “Buffett indicator”, it is very close to a collapse.
How the Buffett indicator is calculated
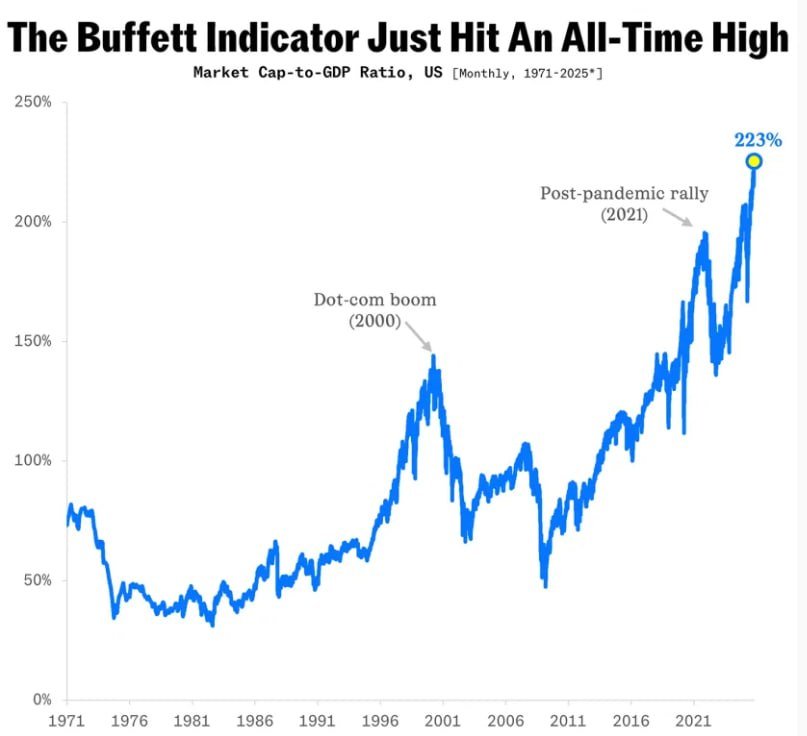
This indicator compares the total market value of US stocks (currently at approximately $72 trillion) with the volume of gross domestic product. It currently shows the stock market to be more than twice the size of the economy, with GDP posting record growth rates over the past two years.
Once called “probably the best single measure of the current state of valuations” by the investor for whom it is named, Buffett’s indicator just hit an alarming 225%, its highest level ever, joining a growing chorus of market commentators who believe we could be headed for a correction.
Why market valuations are raising concerns
Along with the Buffett indicator, other indicators also flash amber or red. Investors are paying record prices for every dollar of future S&P 500 earnings, and the market is increasingly concentrated in the hands of a few large-cap companies, with eight technology stocks now accounting for about 40% of the S&P 500’s value.
Why the 200% level matters
Back in 2001, Buffett warned that approaching 200% would mean “playing with fire.”