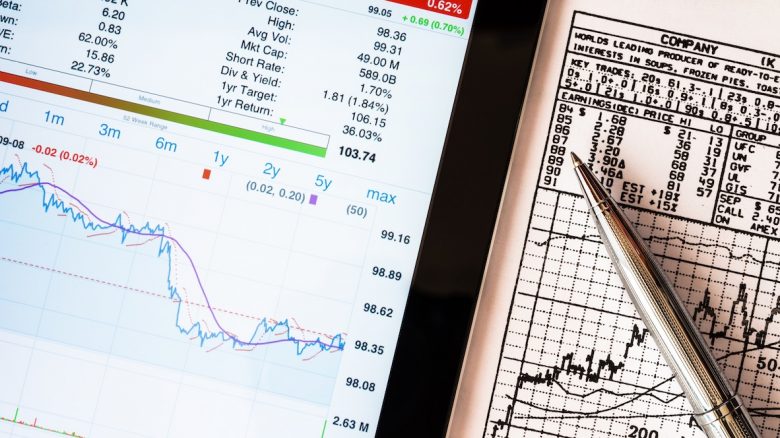
- Fundamental analysis
- Technical analysis
Combining fundamental and technical analysis
Do you want to know how to make money from this?
Register for free and get expert advice, access to a training course and webinars.
The question of the possibility of using technical analysis as a full-fledged alternative to fundamental analysis is one of the most pressing among traders. Although there is no clear answer, it is clear that combining the strengths of both strategies can lead to a better understanding of markets and predict investment prospects.
In this article, ParadTrade looks at situations in which integrating both methods would be useful or even necessary.
Trading volume trends
When analyzing stocks, it is important for an investor to understand the opinions of other market participants. Having information about investor sentiment can provide valuable insight into a company and potential market trends.
One of the most popular methods for assessing market sentiment is to analyze changes in trading volume. Sharp spikes in volume can signal increased interest in a stock from the trading community, which may be due to the accumulation or distribution of positions.
But aside from sentiment analysis, volume indicators are also very popular among traders as they can confirm or deny a view on a security. Traders often see volume increase as a trend gains momentum. A sudden decrease in volume may signal a loss of interest on the part of traders and a possible trend reversal.
Recently, more and more traders are using intraday charts. This allows them to track spikes in volume that often coincide with large trades. Analyzing such spikes can be very useful in identifying moments when large players are active in the market.
Tracking short-term dynamics
While many fans of fundamental analysis have a long-term focus, they are also interested in getting a good price when buying and/or selling stocks. In such situations, technical analysis can become a valuable assistant.
One example of the use of technical analysis in this case is the use of moving averages. When a stock breaks its 15- or 21-day moving average, it is likely to continue moving in that direction for a short period of time. This allows traders to predict short-term price movements and make more informed decisions.
It’s worth noting that 50- and 200-day moving averages are more often used to determine long-term trends.
For traders who want to optimize the timing of trades and get the best possible entry or exit price for a particular stock, charting and technical analysis are invaluable tools.
Tracking patterns in the market
Many analysts who rely on fundamental analysis also study charts of stocks, industries, indices, or markets to understand how those assets have reacted to news in the past.
Analysis of historical data reveals recurring patterns in investor behavior. For example, housing stocks often fall following Fed decisions to raise interest rates. Likewise, home improvement store stocks could see negative momentum following the release of data showing a decline in real estate sales.
By studying these patterns, investors can predict how the market will react to certain news in the future.
Do you want to know
How to make money from the news
Register for free and get:
- Expert consultation;
- Access to the training course;
- Opportunity to participate in webinars

