
LTF in trading: how to work on lower timeframes

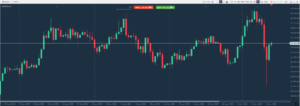
LTF (Lower Time Frame) are lower time frames of the chart, which show more detailed and short-term price movement.
Key characteristics of lower timeframes
- Lower time frames:usually from 1 minute to 15 minutes (M1, M5, M15), sometimes up to 1 hour (M30, H1) – used to accurately search for entry and exit points.
- High sensitivity: small price fluctuations are visible on LTF, which are not noticeable on higher timeframes.
- Noisy: high proportion of random movements and false signals, so careful filtering and confirmation from higher time frames (HTF) is required.
LTF allows you to analyze market structure within large movements and see how patterns and levels are formed in real time.
Practical LTF use cases
- Searching for an entry: on the daily chart (HTF) an upward trend is defined, and on the M5 (LTF) the trader is looking for a local correction to enter along the trend with a minimum stop loss.
- Scalping: the trader opens many intraday trades on M1-M5, taking advantage of rapid price fluctuations.
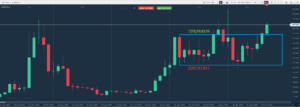
- Breakout confirmation: On M15, the price is visible consolidating above the resistance level, which confirms the signal on the higher timeframe.
Guidelines for working with LTF
- Use LTF to accurately enter trades, but determine trade direction using higher time frames (HTF).
- Always analyze the context: lower timeframes should be consistent with the overall trend.
- Place shorter stop losses and take profits, given the high volatility and fast movements on LTF.
- Avoid trading only LTF without understanding the overall market picture – this increases the risk of false signals.
How LTF fits into a broader trading plan
LTF is a trader’s “microscope”. It helps to see the internal structure of price movement and find the most accurate entry points, remaining in agreement with the global trend.
Your feedback
Was this article helpful?
Related articles
-
Technical analysis
2 minShort squeeze in trading: causes, signs and risks
Short squeeze is a sharp increase in the price of an asset caused by the forced closure of short positions, which leads to an avalanche-like increase in demand and accelerates the upward movement. Characteristics Cause of occurrence: Occurs when a large number of traders hold short positions and the price unexpectedly begins to rise, forcing […]
1 0Read article -
Technical analysis
2 minDiscount and premium zones in trading: how to determine them
Discount and premium zones are price areas on a chart that reflect where an asset is trading below or above its “fair” value relative to the previous market structure. Characteristics Discount zone: The lower part of the price range (usually below 50% of the last impulse movement). Here the asset is considered undervalued, demand prevails, […]
0 0Read article -
Technical analysis
2 minConsolidation in trading: signs and range trading
Consolidation is a phase of sideways price movement when the market accumulates strength before a new impulse. Key signs of consolidation 1. Lateral movement in range The price fluctuates between clear support and resistance levels without a clear trend. 2. Narrowing volatility The amplitude of the oscillations decreases (for example, a triangle or rectangle is […]
2 0Read article -
Technical analysis
2 minLevel breakdown in trading: signs, confirmation and risks
A breakout is when price moves beyond a key support/resistance level, trend line, or consolidation zone, often leading to a strong move. How to confirm a genuine breakout 1. Clear breakout level The price overcomes a significant level (historical high/low, consolidation zone, moving average). 2. Volume Confirmation The breakdown is accompanied by an increase in […]
2 0Read article -
Technical analysis
2 minCorrection in trading: how to recognize a price rollback after a breakout
Correction after a breakthrough movement (rollback from a level) is a temporary return of the price to the zone of the broken level before the continuation of the main trend. Here are 10 key characteristics of this condition: How to identify a correction after a breakout 1. Previous level breakout A correction occurs after a […]
2 0Read article -
Technical analysis
4 minTechnical Analysis for Beginners: Basics, Methods and Tools
Introduction Technical analysis is a method of predicting future price movements based on analysis of historical data. This approach is widely used by traders and investors to make informed decisions in financial markets. Unlike fundamental analysis, which takes into account economic, financial and other qualitative and quantitative factors, technical analysis focuses solely on prices and […]
1 0Read article -
Technical analysis
6 minTrading Gaps Explained: Types, Causes and Strategies
Even beginners know that a price trend is not a straight and stable line, but a graph of ups and downs. But there is one thing that often confuses novice traders. And these are gaps. At first glance, they seem to be just empty space that interrupts the price movement. However, their prevalence and impact […]
2 0Read article -
Technical analysis
3 minPips and Points in Trading: Meaning, Value and Examples
Do you trade Forex, but don’t understand what a pip/point is? Then you are unlikely to succeed! After all, these are the fundamental units of measurement that determine profit or loss in Forex trading, and trading without a clear understanding of these concepts is like going to an exam without a pen. But understanding the […]
1 0Read article