
Technical Analysis for Beginners: Basics, Methods and Tools
 ParadTrade
Introduction
Technical analysis is a method of predicting future price movements based on analysis of historical data. This approach is widely used by traders and investors to make informed decisions in financial markets. Unlike fundamental analysis, which takes into account economic, financial and other qualitative and quantitative factors, technical analysis focuses solely on prices and trading volumes.
Basic tools of technical analysis
Graphs and their types
Charts are the main tool of technical analysis, allowing you to visualize price movements. Let’s look at the main types of charts:
Line Chart: A line chart displays the closing price for each period by connecting them with a line. This type of chart is simple and intuitive, making it ideal for new traders. However, it provides minimal information as it only shows the closing price.
Bar Chart: A bar chart consists of vertical bars, each of which displays the opening, high, low and closing price for a certain period. The top point of the column is the maximum, the bottom point is the minimum, the horizontal lines on the left and right are the open and close, respectively. This type of graph provides more detailed information but can be difficult for beginners to understand.
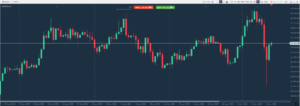
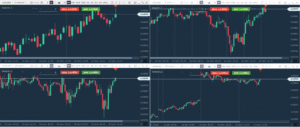
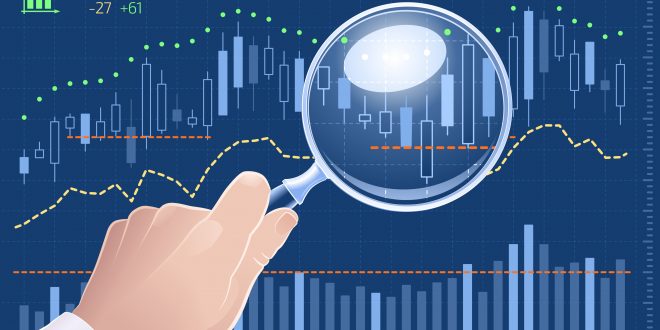
Candlestick Chart: A candlestick chart includes the same data as a bar chart, but is visually more understandable. Each candle shows the opening, closing, high and low price for a certain period. The body of the candle reflects the range between the opening and closing prices, and the shadows reflect the highs and lows. Candles can be bullish (rising) or bearish (falling).
Trends
Trend is the direction of market movement. There are three main types of trends:
Uptrend: Prices rise, forming a sequence of higher highs and lows. This signals a bullish market and traders tend to consider buying opportunities.
Downtrend: Prices fall, forming a sequence of lower highs and lows. This signals a bearish market and traders tend to consider selling opportunities.
Sideways: Prices fluctuate in a narrow range with no clear direction. In this case, traders often refrain from trading or use range trading strategies.
Indicators
Indicators are mathematical calculations based on prices and trading volumes. They help traders interpret market data and make informed decisions. Let’s consider several popular indicators:
Moving Averages:Moving averages help smooth out price data to identify trends. There are several types of moving averages: simple (SMA), exponential (EMA) and weighted (WMA). Moving average crossovers can signal the start or end of a trend.
Relative Strength Index (RSI): RSI measures the speed and change of price movements. RSI values range from 0 to 100, and an asset is considered overbought when it is above 70 and oversold when it is below 30. This helps traders identify trend reversal points.
Stochastic (Stochastic): Stochastic compares the current price of an asset with its price range over a certain period. The values range from 0 to 100, and the stochastic helps identify trend reversal points.
Support and resistance levels
Supportand resistancelevels are price levels where supply and demand tend to change:
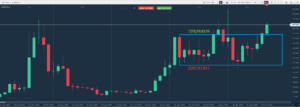
Support: The level at which a price tends to find support when falling, preventing it from falling further. This is due to increased demand for the asset at a given price.
Resistance: The level at which a price typically encounters resistance when rising, preventing it from rising further. This is due to an increase in the supply of the asset at a given price.
Examples of using technical analysis
Forecasting price movements
Technical analysis allows traders to predict future price movements based on historical data. For example, in an uptrend, traders may look for entry points at support levels to take advantage of a possible continuation of the trend.
Trend analysis
Determining the current trend and its duration helps traders make informed decisions. For example, in an uptrend you can consider buying, and in a downtrend you can consider selling. The use of moving averages and indicators such as RSI and stochastics help confirm a trend and determine its strength.
Defining entry and exit points
Using indicators and support and resistance levels, traders can find optimal entry points and exit. For example, a moving average crossover can signal the start of a new trend, providing a buying or selling opportunity. RSI and stochastic help identify overbought or oversold market conditions, which can also serve as an entry or exit signal.
Conclusion
Technical analysis is a powerful tool that helps traders and investors make informed decisions. It includes analysis of charts, trends, indicators and support and resistance levels. Successful use of technical analysis takes time and practice, but mastering these fundamentals will help improve your trading and investing results.
To better understand the nuances of technical analysis and avoid common misconceptions, read our article “7 myths about technical analysis”.