
Technical analysis: basic terms
 ParadTrade

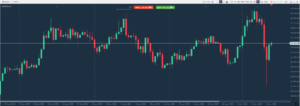
Price models are a necessary tool for each trader, which are displayed as identifiable sequences shown in the charts of technical analysis. These patterns can be used to study past price movements and predict future movements for a particular trading instrument.
In this article, we will look at the basic terms of technical analysis and how to correctly interpret patterns once they are identified.
Duration
The duration of the price model is an important factor in interpreting the model and predicting future price movements.
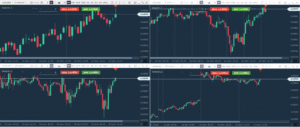
Patterns that occur over a longer period of time tend to be more robust: larger movements occur when prices move beyond the pattern. Thus, it is expected that the pattern developing on the daily chart will lead to more movement than the same pattern observed on the intraday chart – for example, on the minute chart. Similarly, a pattern formed on a monthly chart is likely to result in a more substantial price movement than the same pattern on a daily chart.
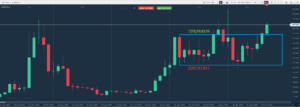
When the price finally breaks out of the price model, it can mean a significant change in sentiment. The longer the duration, the harder buyers will have to push to break above the resistance area (and the harder sellers will have to push to break below the support area), resulting in a more significant move once the price breaks through in either direction.
Volatility
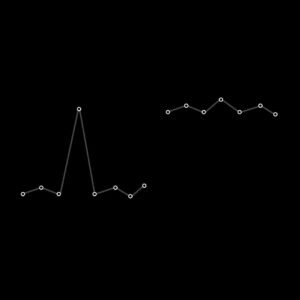
Similarly, the degree of price fluctuations within the price model can be useful in analyzing the reliability of the price model, as well as in predicting the magnitude of a possible price breakthrough. Volatility is the measurement of price changes over time. Large price swings point to increased volatility, a condition that can be interpreted as a more active fight between bears who try to bring prices down and bulls who try to push prices up. Patterns showing a higher degree of volatility will lead to more significant price changes.
The higher the volatility of the price pattern, the greater the expectation, which leads to a more significant, explosive movement of the price as it overcomes the level of support or resistance.
Trading volume
Trading volume is another factor in interpreting price patterns. It refers to the number of units of a particular trading instrument that have changed hands over a period of time. Usually, the volume of a trading instrument is displayed as a histogram or a series of vertical lines appearing under the price chart. Volume is most useful when measured against its recent past. The changes in the volume of purchases and sales that occur can be compared with recent activity and analyzed: any volumetric activity that deviates from the norm can indicate an upcoming price change.
If the price breaks above or below the area of resistance or support, respectively, and is accompanied by a sudden increase in the interest of investors and traders represented as volume, the price movement will be significant. The increase in volume can confirm the validity of the price breakthrough. On the other hand, a breakthrough without a noticeable increase in volume is much more likely to fail, as there is no enthusiasm to support this movement, especially if the movement is directed upwards.
Recommendations for the interpretation of regularities
Here are three basic steps that help technical analysts interpret price patterns:
Identification.The first step in successfully interpreting price patterns is to identify valid models in real time. Often patterns are easy to detect in historical data, but it becomes more difficult to identify them during their formation. Traders and investors can practice identifying patterns from past data, paying close attention to the method used to build trend lines.
Evaluation.Once the pattern is determined, it can be evaluated. Traders and investors can take into account the duration of the model, the associated volume and volatility of price fluctuations within the price model. Their assessment can give a better idea of its credibility.
Forecast.Once the model is defined and priced, traders and investors can use this information to predict future price movements. Naturally, price patterns do not always match, and identifying them does not guarantee that any particular price action will occur. However, market participants can keep an eye on the probability that may occur, allowing them to respond quickly to changing market conditions.
Would you like to receive information from us in a different format? Then subscribe to ours.InstagramRead our articles in the form of cards!
Quick answers
Frequently asked questions
What does technical analysis examine?
Technical analysis studies price, volume and market behaviour to describe trends, levels and possible scenarios rather than guarantee future outcomes.
How is support different from resistance?
Support is an area where demand previously slowed a decline, while resistance is an area where supply previously limited an advance.
Is one indicator enough for a trading decision?
A single indicator rarely provides enough context. Traders usually compare it with price structure, volatility, volume and predefined risk.